Home Blog Page 8

Home Insurers Struggle With Customer Loyalty as Boomers Flock to Rental Market, J.D. Power Finds

0

The great Boomer migration from home ownership to renting is upon us. About two-thirds of all rental housing growth between 2004 and 2019 was driven by adults age 55 and older, and that group now accounts for approximately 30% of the total rental market.1 According to the J.D. Power 2021 U.S. Home Insurance Study,SM released today, home insurers have struggled to navigate that transition with products and services designed to maximize customer lifetime value.

“The generational shift from home ownership to renting represents a significant customer retention risk unless insurers figure out a better way to maintain customer loyalty throughout this critical life phase,” said Robert M. Lajdziak, senior consultant of insurance intelligence at J.D. Power. “So far, most insurers are missing that mark. Consider the stats: 44% of combined Boomers2 and Pre-Boomers who are renters today had homeowners insurance in the past, but only 52% of them now have their renters policy with the same carrier. Recognizing that annual retention for homeowners is 91.7%, there is a huge opportunity out there for insurers that get the life stage transition formula right, but the scale of this generational movement will likely drive a great deal of switching activity in the future.”

Following are some key findings of the 2021 study:

Insurers struggle with transition from homeowners to renters policies: Just more than half (52%) of combined Boomers and Pre-Boomers who have transitioned from homeowners to renters policies stay loyal to the same insurer. That number falls to 44% among Generation X insureds and 36% among insureds in Generations Y and Z.  Compared with the industry average, USAA, State Farm and Amica Mutual have particularly high rates of retention as their homeowners insurance customers transition to renters insurance customers.

Service experience—not price—is key to lifetime value: Among renters who remain loyal to their previous homeowners insurance brand, the most common reasons for staying with the same carrier are good service experience, brand reputation, bundled products and convenience. Price is fifth on the list.

Bundling builds loyalty, but legacy systems often limit cross-product visibility: Among renters who previously had a homeowners policy, those who bundle insurance products with their renters policy are two times more likely to stay loyal to the same carrier. Insureds interacting with agents are the most likely to have their household’s bundled products acknowledged, suggesting the legacy systems used by many insurers are not designed to enable customers to be treated as a household but rather as a policy number.

Trust has significant influence on retention: Homeowners who have a strong perception that their insurer is trustworthy are four times more likely to say they “definitely will” renew with their insurer than those who do not have a favorable perception of their insurer’s trustworthiness.

Smart home technologies create opportunity: More than half (59%) of homeowners with a smart home product installed in their home, such as a doorbell camera or automatic water shutoff valve, say that having a smart home feature has helped to prevent or lessen damage to property. This presents a clear opportunity for insurers to increase preventative service offerings, which is a major shift in the value proposition by focusing on preventing a loss rather than protection after a loss.

Study Rankings

Amica Mutual ranks highest in the homeowners insurance segment, with a score of 854 (on a 1,000-point scale). Automobile Club of Southern California (840) ranks second, while Erie Insurance (835) and State Farm (835) rank third in a tie.

Lemonade ranks highest in the renters insurance segment with a score of 870. State Farm (866) ranks second.

The U.S. Home Insurance Study examines overall customer satisfaction with two distinct personal insurance product lines: homeowners and renters. Satisfaction in the homeowners and renters insurance segments is measured by examining five factors: interaction; policy offerings; price; billing process and policy information; and claims. The study is based on responses from 11,828 homeowners and renters via online interviews conducted from May through July 2021.

For more information about the U.S. Home Insurance Study, visit https://www.jdpower.com/business/insurance/us-home-insurance-study.

1“Housing Perspectives,” Joint Center for Housing Studies of Harvard University, December 17, 2020 https://www.jchs.harvard.edu/blog/ten-insights-about-older-households-2020-state-nations-housing-report

2J.D. Power defines generational groups as Pre-Boomers (born before 1946); Boomers (1946-1964); Gen X (1965-1976); Gen Y (1977-1994); and Gen Z (1995-2004). Millennials (1982-1994) are a subset of Gen Y.

Home Insurers Struggle With Customer Loyalty as Boomers Flock to Rental Market, J.D. Power Finds

CoreLogic Estimates $16 Billion to $24 Billion in Insured and Uninsured Flood Losses in the Northeast from Tropical Storm Ida

0

CoreLogic, a leading global property information, analytics and data-enabled solutions provider, today released additional loss estimates for Hurricane Ida, following its initial release estimating between $27 billion and $40 billion in insured and uninsured losses from wind, storm surge and inland flooding in Louisiana and Mississippi. According to this new analysis, specifically for the U.S. Northeast, subsequent Tropical Storm Ida caused an estimated $16 billion to $24 billion in insured and uninsured inland flood losses to residential and commercial properties.

Total insured flood loss for residential and commercial properties in the U.S. Northeast is estimated to be between $5 billion and $8 billion, while uninsured flood loss for this area is estimated to be between $11 billion and $16 billion. Pennsylvania, New Jersey, New York, Connecticut and Massachusetts sustained approximately 90% of the losses.

“Given the prevalence of multifamily housing and below-ground structures in these areas, we’ll see more extreme interior content damages than we typically see in southern coastal areas,” said Shelly Yerkes, senior leader, insurance solutions at CoreLogic. “For example, many of the heating, ventilation and air conditioning systems in New York City buildings are in the basements, so contents damage should be substantial.”

After Hurricane Ida made landfall in Port Fourchon, La. on August 26, it continued to travel northeast as it downgraded to a tropical storm status, bringing devastating rainfall of six-to-nine inches in three hours in New York, New Jersey and surrounding states. This record-setting precipitation caused a flash flood event as the rain overwhelmed storm water drainage systems in urban areas where the average monthly rainfall is approximately three inches and little green space exists to absorb sudden inundations of water. Tropical Storm Ida’s flood event affected a region nearby Superstorm Sandy’s impact area in 2012, which caused extensive storm surge-related flooding along the coastlines and shorelines of the East River and the Hudson River. Catastrophic weather events like these are becoming more common and local governments and property owners are taking note, making infrastructure and home resilience improvements in the wake of the recent storms.

“The flooding from Superstorm Sandy was more severe than Tropical Storm Ida,” said David Smith, senior leader of science and analytics at CoreLogic. “Due to the repairs made in 2012, such as strengthening buildings and infrastructure and addressing deferred maintenance, New York was less vulnerable. Tropical Storm Ida’s effects on New Yorkers would have been worse if we hadn’t conducted these resilience-based repairs after Superstorm Sandy.”

This analysis includes residential homes and commercial properties, including contents and business interruption and does not include broader economic loss from the storm.

Visit the CoreLogic natural hazard risk information center, Hazard HQ™, at www.hazardhq.com to get access to the most up-to-date Hurricane Ida storm data and see reports from previous weather events.

Methodology

CoreLogic offers high-resolution location information solutions with a view of hazard and vulnerability consistent with the latest science for more realistic risk differentiation. The high-resolution flood modeling using 10m digital elevation model (DEM) and structure- and parcel-based geocoding precision from PxPoint™ facilitates this realistic view of risk, including both fluvial (riverine) and pluvial (surface) flooding. Single-family residential structures less than four stories, including mobile homes, duplexes, manufactured homes and cabins (among other non-traditional home types) are included in this analysis. Multifamily residences and commercial properties are also included.

Source: CoreLogic

CoreLogic Estimates $16 Billion to $24 Billion in Insured and Uninsured Flood Losses in the Northeast from Tropical Storm Ida

CoreLogic Estimates $16 Billion to $24 Billion in Insured and Uninsured Flood Losses in the Northeast from Tropical Storm Ida

2021 Liberty Mutual Insurance Workplace Safety Index Helps Companies Better Protect Employees and Control Costs as the Economy Continues to Reopen

annual medical costs and lost wage payments, according to the latest Liberty Mutual Workplace Safety Index.

“Understanding the top risks in the workplace is the first step in better protecting employees and the bottom line,” said Liberty Mutual General Manager, Risk Control Services, Jamie Merendino. “The Liberty Mutual Workplace Safety Index gives companies a critical starting point, letting them partner with insurers, brokers and agents to understand what causes their most serious injuries and what can be done to improve workplace safety.”

The top 5 causes of workplace accidents across the broad economy are:

2021 Liberty Mutual Insurance Workplace Safety Index Helps Companies Better Protect Employees and Control Costs as the Economy Continues to Reopen

Click below to understand the causes and costs of the most serious workplace injuries in a specific industry:

Construction

Manufacturing

Healthcare and Social Assistance

Retail

For over 20 years, Liberty Mutual has developed its annual Workplace Safety Index. The study is based on information from Liberty Mutual, the U.S. Bureau of Labor Statistics (BLS) and the National Academy of Social Insurance. Liberty Mutual and BLS injury data are analyzed to determine which events caused employees to miss more than five days of work. The index then ranks those events by total workers compensation costs, which include medical and lost-wage payments. To capture accurate injury cost data, each index is based on data three years prior. Accordingly, the 2021 index reflects 2018 data.

Given the methodology used to create the annual Liberty Mutual Workplace Safety Index, the latest report does not reflect the impact of Covid-19. Liberty Mutual provides a wealth of online content to help companies and brokers understand and minimize the Pandemic’s impact on the workplace.

Active Hurricane Seasons: The New Normal

0

Although Hurricane Henri was downgraded to a tropical storm and narrowly missed densely populated Long Island, New York, Kroll Bond Rating Agency (KBRA) notes the following as we approach the peak of hurricane season:

  • An increase in landfall events will continue and further challenge the risk management of property insurers.
  • Hurricane Henri, which made landfall as a tropical storm in Rhode Island, will be a relatively minor loss event for the industry. However, insurers who have increased their catastrophe retentions will have earnings declines and experience surplus erosion.
  • There will be significant uninsured losses for individual homeowners from storm surge and flooding.

The Winds of Change
The Colorado State University (CSU) Tropical Meteorology Project team—one of the pioneers of hurricane forecasting— updated on August 5 its Atlantic hurricane season forecast, which calls for the sixth consecutive year of above-average activity. In 2021, the Atlantic produced a pre-season storm for the seventh year in a row, following the formation of Tropical Storm Ana on May 22. In the same month, the National Oceanic and Atmospheric Administration (NOAA) released its latest 30-year average, which is re-established every 10 years.1 The average number of named storms, hurricanes, and major hurricanes have continued to increase (see Figure 1). The new 30-year average is over 40% higher for named storms and 60% higher for major hurricanes than the 30-year average from 1971 to 2000. Tropical cyclone activity over the last five years has witnessed a similar trend toward the “new normal.”

Figure 1: Historical Atlantic Hurricane Seasons
Historical Average Hurricane Season Actual Results Forecast
1971 – 2000 1981 – 2010 1991 – 2020 2016 2017 2018 2019 2020 2021
Named Storms 10.1 12.1 14.4 15 17 15 18 30 18
Hurricanes 5.6 6.4 7.2 7 10 8 6 13 8
Major Hurricanes 2.0 2.7 3.2 4 6 2 3 6 4
Sources: Colorado State University, NOAA


As KBRA previously noted, the 2020 Atlantic hurricane season saw a record-breaking 30 named storms, including 13 hurricanes and six major hurricanes. The number of named storms exhausted the 21 annual pre-designated list of names, with the last nine named storms designated with Greek letters. This was only the second time in history that the Greek alphabet was used; and it will also be the last. Following the 2020 season, the World Meteorology Organization (WMO) decided to discontinue the use of Greek alphabet names if the season’s list of names gets exhausted again. Going forward, they will use a list of 21 supplemental names developed by the WMO,2 which follows the existing English alphabetical naming convention, and suggests the WMO expects the need for more than 21 names in a hurricane season will be more typical than in the past.

As with 2020, named storms in 2021 are far outpacing the historical average (see Figure 2). While CSU’s latest forecast calls for 18 named storms (down from its previous forecast of 20), other forecasts range between 20 and 25. A scenario in which there are 20 named storms would rank 2021 in the top three active hurricane seasons of all time, following 2020 and 2005.

Climate Change and Increased Landfalls
KBRA also notes that while there are differing views within the scientific community as to whether climate change is helping to generate increased frequency of hurricanes, there is general consensus that climate change has contributed to greater storm severity. The Center for Climate and Energy Solutions (C2ES) states that “Although scientists are uncertain whether climate change will lead to an increase in the number of hurricanes, there is more confidence that warmer ocean temperatures and higher sea levels are expected to boost their intensity and impacts. Stronger hurricanes will be far more costly in terms of damages and deaths without action to make coastal (and inland) areas more resilient.”3 Of the 30 named storms in 2020, a record 12 made landfall in the U.S. This trend has continued into 2021, as five of the first eight named storms have made landfall in the U.S. (see Figure 3), and six named storms have made landfall in the Americas.

Figure 3: 2021 Atlantic Hurricane Season – Named Storms Landfalls
Name Dates Max Wind Category Landfall Geographies Affected
Tropical Storm Claudette June 19 – June 22 45 MPH TS LA AL, GA, LA, MS, NC, SC
Tropical Storm Danny June 28 – June 29 45 MPH TS SC GA, SC
Hurricane Elsa July 1 – July 9 85 MPH Cat 1 FL Caribbean, East Coast U.S.
Tropical Storm Fred Aug 9 – Aug 20 65 MPH TS FL Southeastern & Northeastern U.S.
Hurricane Grace Aug 13 – Aug 21 120 MPH Cat 3 Mexico Caribbean, Mexico
Hurricane Henri Aug 20 – Aug 23 90 MPH Cat 1 RI New England, NY, NJ
Sources: NOAA, News Reports, Insurance Information Institute, KBRA


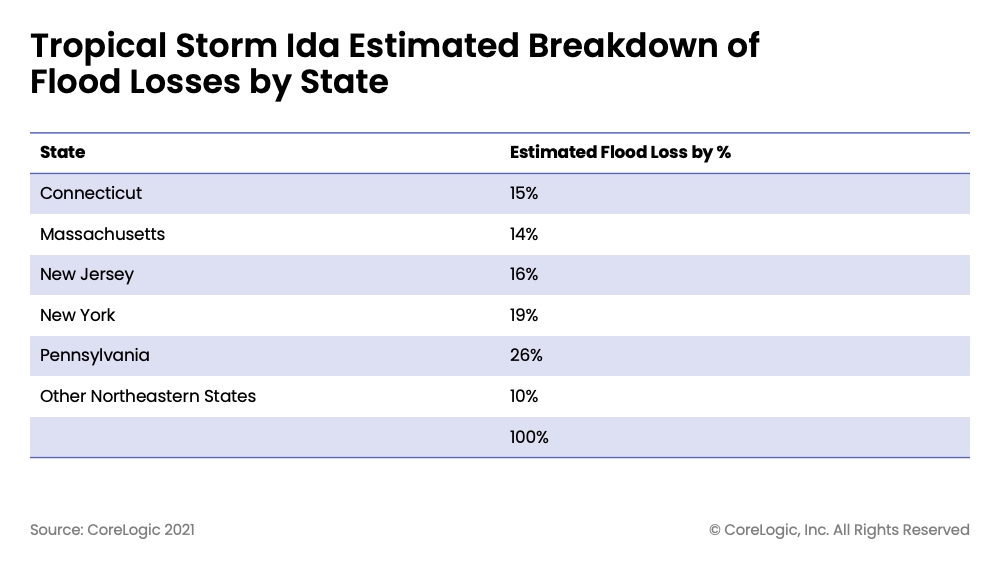
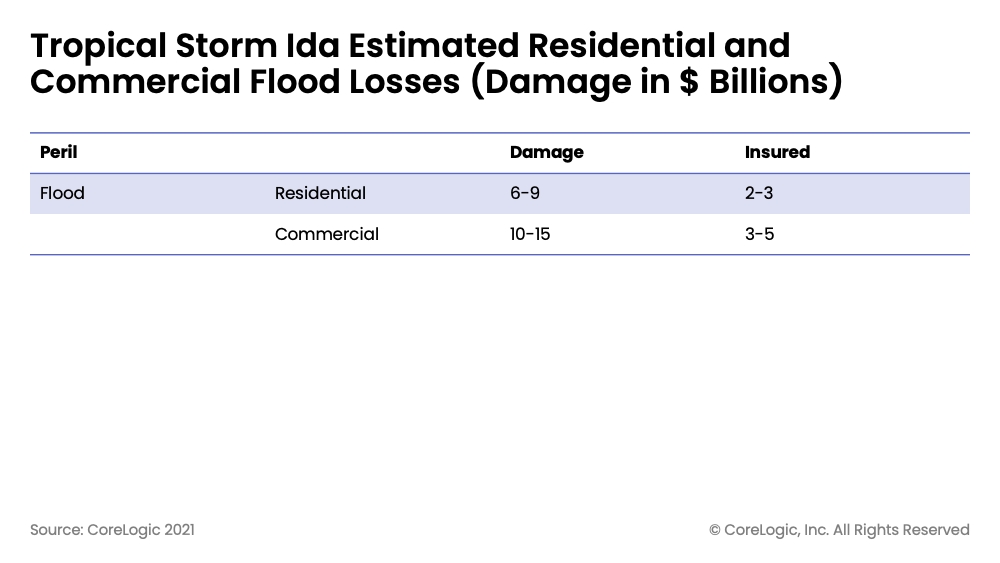
Uninsured Losses Increasing
Due to the significant increase in population, properties, and property values in coastal areas, exposure to flooding (which is often uninsured) is rising—which is likely to drive up flood losses, even in the absence of more frequent and/or more severe flooding events. “After Hurricane Harvey in 2017, CoreLogic estimated that 70% of the flood damage was uninsured,” said Dr. Howard Botts, executive and chief scientist at CoreLogic. Although industry insured loss estimates from Hurricane Henri are likely to be minimal, it is likely that individual homeowners will experience significant uninsured losses from Hurricane Henri, which produced dangerous storm surges and heavy rainfall in parts of Long Island, New York; New Jersey; Connecticut; Massachusetts; and Rhode Island (see Figure 4).

In regard to personal property, standard homeowners insurance does not protect policyholders from flood losses and storm surge, creating a potential coverage gap. Instead, homeowners must rely heavily on the National Flood Insurance Program (NFIP) for coverage from catastrophic flooding. The NFIP allows property owners in certain communities to purchase flood insurance through the federal government. And while homeowners in certain flood zones are mandated to buy flood insurance, in the non-mandated flood zones (which are still exposed to significant flood risk), less than 10% of homeowners purchase an NFIP policy. Furthermore, even for those who purchase NFIP insurance, the amount of coverage is limited and commonly inadequate relative to the value at risk. Going forward, if private flood insurers develop a more robust market for flood insurance, KBRA believes uninsured losses could decline and reduce reliance on the NFIP.

Looking Ahead
Entering 2021, the property/casualty (P/C) insurance industry had achieved record levels of policyholder surplus, which KBRA believes is sufficient to absorb catastrophes similar to those of the past five years, even in combination with a moderate investment downturn. However, elevated catastrophe activity over the past five years has steadily driven reinsurance pricing higher and some primary insurers with unfavorable loss experience chose to restructure their reinsurance programs to manage sharply rising costs. In some cases, retentions were increased, while total limits were reduced. If the recent pattern of active hurricane seasons has ushered in a new normal of natural catastrophes, P/C insurers (especially smaller regional companies) will need to redouble their focus on underwriting profitability and risk management to protect their financial strength.

Related Reports

© Copyright 2021, Kroll Bond Rating Agency, LLC and/or its affiliates and licensors (together, “KBRA”). All rights reserved. All information contained herein is proprietary to KBRA and is protected by copyright and other intellectual property law, and none of such information may be copied or otherwise reproduced, further transmitted, redistributed, repackaged or resold, in whole or in part, by any person, without KBRA’s prior express written consent. Information, including any ratings, is licensed by KBRA under these conditions. Misappropriation or misuse of KBRA information may cause serious damage to KBRA for which money damages may not constitute a sufficient remedy; KBRA shall have the right to obtain an injunction or other equitable relief in addition to any other remedies. The statements contained herein are based solely upon the opinions of KBRA and the data and information available to the authors at the time of publication. All information contained herein is obtained by KBRA from sources believed by it to be accurate and reliable; however, all information, including any ratings, is provided “AS IS”. No warranty, express or implied, as to the accuracy, timeliness, completeness, merchantability, or fitness for any particular purpose of any rating or other opinion or information is given or made by KBRA. Under no circumstances shall KBRA have any liability resulting from the use of any such information, including without limitation, for any indirect, special, consequential, incidental or compensatory damages whatsoever (including without limitation, loss of profits, revenue or goodwill), even if KBRA is advised of the possibility of such damages. The credit ratings, if any, and analysis constituting part of the information contained herein are, and must be construed solely as, statements of opinion and not statements of fact or recommendations to purchase, sell or hold any securities. KBRA receives compensation for its rating activities from issuers, insurers, guarantors and/or underwriters of debt securities for assigning ratings and from subscribers to its website. Please read KBRA’s full disclaimers and terms of use at www.kbra.com.

______________________________
1 https://www.accuweather.com/en/hurricane/average-hurricane-season-has-a-new-normal/905558
2 https://weather.com/storms/hurricane/news/2021-03-15-hurricane-laura-dorian-names-retired-wmo
3 https://www.c2es.org/content/hurricanes-and-climate-change/


AmTrust 2021 Contractor Risk Report: First Year Employees Pose Greatest Injury Risk With a Third of Claims Paid Out

AmTrust Financial Services, Inc. (“AmTrust” or the “Company”), a global specialty property and casualty insurer, today released the AmTrust 2021 Contractor Risk Report, identifying common injuries and the resulting time off work for the specialized group. The report, based on 26,000 workers’ compensation claims over 10 years, found that companies in business less than four years make up 75 percent of claims paid out. The report also determined that new employees pose the greatest injury risk, and that workers’ compensation claims peak in the summer.

“The most valuable asset of any company is its employees, and with the current labor shortage, employers need to be armed with recent data to improve workplace safety and help reduce injuries,” said Matt Zender, Senior Vice President, Workers’ Compensation Strategy at AmTrust. “Our new risk report for contractors brings awareness to common injuries, allowing small businesses to better mitigate losses and help keep their workforce healthy and productive.”

States with warmer climates make up the most historical losses, partly because contractors have a year-round season for outdoor work. While warmer weather allows for more opportunities for contractors, environmental issues including heat and smog increase workers’ comp claims in warmer months. For example:

  • Arizona claim frequencies are 42% above US average
  • Florida claim frequencies are 34% above US average
  • California claim frequencies are 7% above US average

Other key findings from the report include:

  • Plumbers make up 28% of all claims, while electricians make up 19%
  • Fall or slip lost days are 67% greater than the median for all injuries (21 days)
  • While lifting strains are the most common injury with 11 days out, burns result in the second-highest median days out (19 days)

The full report is available on AmTrust’s website. Graphics and charts in this report can be used without copyright permission.

AmTrust 2021 Contractor Risk Report: First Year Employees Pose Greatest Injury Risk With a Third of Claims Paid Out

About AmTrust Financial Services, Inc.

AmTrust Financial Services, Inc., a multinational insurance holding company headquartered in New York, offers specialty property and casualty insurance products, including workers’ compensation, businessowners policy (BOP), general liability and extended service and warranty coverage. For more information about AmTrust, visit www.amtrustfinancial.com

Builders Mutual Announces New Leadership Roles

0

Builders Mutual has experienced strong operations and company growth over the last few years as the construction industry is more dynamic than ever. As a result, the company has broadened its leadership team to place greater emphasis on the strategic direction of the company and enhance operational efficiencies. Recently three new senior leadership positions were announced.

Melissa Williard was promoted to the role of Assistant Vice President/Underwriting. Melissa will continue to oversee the Middle Market Underwriting team and will take on an expanded role of leading Underwriting Operations. With 28 years of industry experience and 18 years tenure with Builders Mutual, Melissa brings strong underwriting knowledge and prior operational experience that will allow her to position the Underwriting team for success

Jodi Vedelli was promoted to the role of Assistant Vice President/Strategy. Jodi will enhance Builders Mutual’s ability to drive results through the strategic planning process and increase accountability and commitment to achieving long-term goals. With 21 years in the Property and Casualty insurance industry and 14 years tenure at Builders Mutual, Jodi brings a unique ability to see across the organization with expertise in agency relations, customer service, human resources, marketing, training, underwriting and strategic planning. Jodi will continue to guide the strategic direction of marketing, communications, and the customer experience.

Sherman McCoy rejoined Builders Mutual as Assistant Vice President/Business Operations. Sherman will provide specialized focus on business operations as we align multiple operations functions into one cohesive unit. With a strong background in insurance and agency relationships, Sherman brings over 20 years of experience and a proven ability to lead business operations.

“There are a lot of exciting opportunities ahead for all of us. We’ve established a strong foundation and now is the time for us to look forward to even greater success,” stated Mike Gerber, President/Chief Executive Officer.  “The creation of these three new roles will guide Builders Mutual into the future where we maintain our strong customer focus, build agility to respond to ever changing customer needs and drive innovation to solve tomorrow’s problems today.

Headquartered in North Carolina, Builders Mutual is one of the Mid-Atlantic and Southeast’s leading writers of commercial insurance for the construction industry.  Since its inception, Builders Mutual has broadened its territory beyond North Carolina to include the District of Columbia, Florida, Georgia, Maryland, Mississippi, South Carolina, Tennessee, and Virginia. The company provides coverage to more than 27,000 policyholders through more than 5,000 sales agents and employs more than 380 staff at its Raleigh headquarters.

Harford Mutual Insurance Group Named a 2021 Ward’s 50 Top Performer

Harford Mutual Insurance Group has been named to the Ward’s 50 ® list of top-performing property-casualty insurance companies for 2021. The company was recognized for outstanding financial results in the areas of safety, consistency, and performance over a consecutive five-year period.

“This is an incredible achievement, recognizing our outstanding financial results over the most recent five-year period, highlighted by 2019 and 2020 representing the best years in our storied 178-year history,” said Steven Linkous, President and CEO of Harford Mutual Insurance Group. “The culmination of our results and joining this most elite group are products of an amazing team, wonderful agency partners, and a steadfast Board of Directors executing a strategic vision grounded upon the principles of mutuality.”

Every year, Ward Group, a consulting firm specializing in the insurance industry and a leading provider of industry benchmarking, analyzes the financial performance of nearly 3,000 property-casualty insurers and identifies the top 50 in the United States.

Each company named has passed all safety and consistency tests and achieved superior performance over the five years analyzed. The Ward’s 50 top performers were able to grow revenue, stay profitable, and strengthen surplus position at a greater rate than the total industry.


2021 Outstanding CSR of the Year State Winners

Each year, a group of exceptional insurance professionals are chosen by The National Alliance for Insurance Education & Research to compete for the National Outstanding CSR of the Year Award.

To be eligible for this award, candidates must be insurance customer service representatives or have primary responsibility for insurance customer service duties.

2021 Outstanding CSR of the Year State Winners

Best’s Special Report: Insurers’ Defense-Related Loss Costs Rising for Lines of Business Most Susceptible to Heavy Litigation

0

Defense and cost containment (DCC) expenses for certain lines of property/casualty insurance business are elevated compared with other lines; in particular, medical professional liability and product liability, according to a new AM Best report.

DCC expenses include defense, litigation and medical cost containmentessentially, the cost of settling a claim. The Best’s Special Report, “Defense-Related Loss Costs Rising for Lines Most Susceptible to Heavy Litigation,” notes that as insurance claims become increasingly severe and more complex, insurers have put more focus on working with risk professionals and other stakeholders to limit defense costs.

According to the report, the higher DCC expenses attributable to medical professional liability policies have been associated with expert witness fees, costs to secure medical records and other allocated costs involved in defending physicians. A drop in the medical professional liability segment’s DCC ratio in 2020 likely reflected a benefit from court closures due to the pandemic. In the product liability line, some of the costlier cases have involved protracted litigation typically stemming from product and food recalls. “A number of factors have led to a higher amount of recalls, including enhanced regulatory scrutiny and improved technology,” said Christopher Graham, senior industry analyst, industry research and analytics, AM Best. “These are positive developments for some industries but a negative for insurers given the heightened potential for lawsuits.”

According to the report, the ratio of net DCC expenses to annual incurred losses overall has dropped in the last decade, even on the lines most prone to high-profile lawsuits, which in addition to product liability and medical professional liability, can include worker’s compensation and auto liability. “Predictive analytics for claims handling has helped speed up the claims process and, in turn, has limited claim expenses,” said David Blades, director, industry research and analytics.

To access the full copy of this special report, please visit http://www3.ambest.com/bestweek/purchase.asp?record_code=311432.

A video with Blades and Graham discussing the report is available at http://www.ambest.com/v.asp?v=ambdcccexpenses821.

Builders Mutual Named to Ward’s 50 Top Performing Companies for Safety, Consistency, and Performance

0

Builders Mutual is proud to announce it has been named to the prestigious Ward’s 50 group of top performing companies for the third consecutive year. The recognition focuses on Builders Mutual’s outstanding financial results in the areas of safety, consistency, and performance over a five year period (2016-2020).

This annual designation from the industry-leading organization, Ward Group, identifies companies that pass financial stability requirements and measure their ability to grow while maintaining strong capital positions and underwriting results. To be awarded this designation, insurance companies must pass thresholds of performance and excellence.

“Builders Mutual is proud to receive this recognition from the Ward Group for the third consecutive year, “ said Mike Gerber, President and Chief Executive Officer.  “This achievement is a part of collective effort that begins with our employees and the role they play in making our company the choice for construction-related accounts across our footprint.”

Ward Group is the trusted leader of benchmarking and best practices services for the insurance industry. For the past 30 years, the firm has analyzed the financial performance of nearly 3,000 property-casualty insurance companies and 700 life-health insurance companies, identifying the top performers per segment.

About Ward Benchmarking: Ward Group is the leading provider of benchmarking and best practices studies for the insurance industry. They analyze staff levels, compensation, business practices, and expenses for all areas of company operations and help insurers to measure results compared to peer groups, optimize performance, and improve profitability. Since 1991, Ward has performed more than 3,000 operational and compensation benchmarking exercises for companies of all sizes, including more than half of the top 100 U.S. insurance carriers. For more information, visit ward.aon.com.

About Aon: Aon plc (NYSE:AON) is a leading global professional services firm providing a broad range of risk, retirement and health solutions. Their 50,000 colleagues in 120 countries empower results for clients by using proprietary data and analytics to deliver insights that reduce volatility and improve performance. For further information on Aon capabilities, visit http://aon.mediaroom.com.

About Builders Mutual: Headquartered in North Carolina, Builders Mutual is one of the Mid-Atlantic and Southeast’s leading writers of commercial insurance for the construction industry.  Since its inception, Builders Mutual has broadened its territory beyond North Carolina to include the District of Columbia, Florida, Georgia, Maryland, Mississippi, South Carolina, Tennessee, and Virginia. The company provides coverage to more than 27,000 policyholders through more than 5,000 sales agents and employs more than 380 staff at its Raleigh headquarters.